Listing Embeddings for Similar Listing Recommendations and Real-time Personalization in Search

Authors: Mihajlo Grbovic, Haibin Cheng, Qing Zhang, Lynn Yang, Phillippe Siclait and Matt Jones

Introduction

Airbnb’s marketplace contains millions of diverse listings which potential guests explore through search results generated from a sophisticated Machine Learning model that uses more than hundred signals to decide how to rank a particular listing on the search page. Once a guest views a home they can continue their search by either returning to the results or by browsing the Similar Listing Carousel, where listing recommendations related to the current listing are shown. Together, Search Ranking and Similar Listings drive 99% of our booking conversions.

In this blog post we describe a Listing Embedding technique we developed and deployed at Airbnb for the purpose of improving Similar Listing Recommendations and Real-Time Personalization in Search Ranking. The embeddings are vector representations of Airbnb homes learned from search sessions that allow us to measure similarities between listings. They effectively encode many listing features, such as location, price, listing type, architecture and listing style, all using only 32 float numbers. We believe that the embedding approach for personalization and recommendation is very powerful and useful for any type of online marketplace on the Web.

Background On Embeddings

In a number of Natural Language Processing (NLP) applications classic methods for language modeling that represent words as high-dimensional, sparse vectors have been replaced by Neural Language models that learn word embeddings, i.e. low-dimensional representations of words, through the use of neural networks. The networks are trained by directly taking into account the word order and their co-occurrence, based on the assumption that words frequently appearing together in the sentences also share more statistical dependence. With the development of highly scalable continuous bag-of-words and Skip-gram language models for word representation learning, the embedding models have been shown to obtain state-of-the-art performance on many traditional language tasks after training on large text data.

More recently, the concept of embeddings has been extended beyond word representations to other applications outside of NLP domain. Researchers from the Web Search, E-commerce and Marketplace domains have realized that just like one can train word embeddings by treating a sequence of words in a sentence as context, the same can be done for training embeddings of user actions by treating sequence of user actions as context. Examples include learning representations of items that were clicked or purchased or queries and ads that were clicked. These embeddings have subsequently been leveraged for a variety of recommendations on the Web.

Listing Embeddings

Let us assume we are given a data set of click sessions obtained from N users, where each session s=(L₁,…,Ln)∈ S is defined as an uninterrupted sequence of n listing ids that were clicked by the user. A new session is started whenever there is a time gap of more than 30 minutes between two consecutive user clicks. Given this data set, the aim is to learn a 32-dimensional real-valued representation v(Li) ∈ R³² of each unique listing Li, such that similar listings lie nearby in the embedding space.

The dimensionality of the listing embeddings was set to d = 32, as we found that to be a good trade-off between offline performance (discussed in following section) and the memory needed to store vectors in RAM memory of search machines for the purposes of real-time similarity calculations.

There exist several different ways of training embeddings. We will focus on a technique called Negative Sampling. It starts by initializing the embeddings to random vectors, and proceeds to update them via stochastic gradient descent by reading through search sessions in a sliding window manner. At each step the vector of the central listing is updated by pushing it closer to vectors of positive context listings: listings that were clicked by the same user before and after central listing, within a window of length m (m = 5), and pushing it away from negative context listings: randomly sampled listings (as chances are these are not related to the central listing).

For brevity we’ll skip over the details of the training procedure and focus on explaining several modifications we made to adapt this approach for our own use-case:

  • Using Booked Listing as Global Context: We used sessions that end with the user booking the listing (purple listing) to adapt the optimization such that at each step we predict not only the neighboring clicked listings but also the eventually booked listing as well. As the window slides some listings fall in and out of the context set, while the booked listing always remains within it as global context (dotted line) and is used to update the central listing vector.
  • Adapting to Congregated Search: Users of online travel booking sites typically search only within a single market, i.e. in the location they want to stay at. As a consequence, for a given central listing, the positive context listings mostly consist of listings from the same market, while the negative context listings mostly consists of listings that are not from the same market as they are sampled randomly from entire listing vocabulary. We found that this imbalance leads to learning sub-optimal within-market similarities. To address this issue we propose to add a set of random negatives Dmn, sampled from the market of the central listing.

Considering all of the above, the final optimization objective can be formulated as

booking global context + market negatives optimization formula

where

  • l is the central listing whose vector v(l) is being updated
  • Dp is a positive set of pairs (l,c) that represent (central listing, context listing) tuples whose vectors are being pushed toward one another
  • Dn is a negative set of pairs (l,c) that represent (central listing, random listing) tuples whose vectors are being pushed away from each other
  • lb is booked listing that is treated as global context and pushed toward central listing vector
  • Dmn is a market negatives set of pairs (l,mn) that represent (central listing, random listing from same market) tuples whose vectors are being pushed away from each other

Using the described optimization procedure we learned listing embeddings for 4.5 million active listings on Airbnb using more than 800 million search clicks sessions, resulting in high quality listing representations.

Cold-start Embeddings. Every day new listings are created by hosts and made available on Airbnb. At that point these listings do not have an embedding because they were not present our training data. To create embeddings for a new listing we find 3 geographically closest listings that do have embeddings, and are of same listing type and price range as the new listing, and calculate their mean vector.

What did Embeddings Learn?

To evaluate what characteristics of listings were captured by the embeddings, we examine them in several ways. First, to evaluate if geographical similarity is encoded we performed k-means clustering on learned embeddings. The figure on the left, which shows resulting 100 clusters in California, confirms that listings from similar locations are clustered together. Next, we evaluated average cosine similarities between listings of different types (Entire Home, Private Room, Shared Room) and price ranges and confirmed that cosine similarities between listings of same type and price ranges are much higher compared to similarities between listings of different type and price ranges. Therefore, we can conclude that those two listing characteristics are well encoded in the learned embeddings as well.

While some listing characteristics, such as price, do not need to be learned because they can be extracted from listing meta-data, other types of listing characteristics, such as architecture, style and feel are much harder to extract in form of listing features. To evaluate these characteristics and to be able to conduct fast and easy explorations in the embedding space we developed an internal Similarity Exploration Tool demonstrated in a video below.

https://cdn.embedly.com/widgets/media.html?src=https%3A%2F%2Fwww.youtube.com%2Fembed%2F1kJSAG91TrI%3Ffeature%3Doembed&url=http%3A%2F%2Fwww.youtube.com%2Fwatch%3Fv%3D1kJSAG91TrI&image=https%3A%2F%2Fi.ytimg.com%2Fvi%2F1kJSAG91TrI%2Fhqdefault.jpg&key=a19fcc184b9711e1b4764040d3dc5c07&type=text%2Fhtml&schema=youtube

The video provides many examples of embeddings being able to find similar listings of the same unique architecture, including houseboats, treehouses, castles, etc.

Offline Evaluation of Listing Embeddings

Before testing embeddings in recommendation applications on real search traffic, we conducted several offline tests. We also used these tests to compare several different trained embeddings to reach quick decisions regarding embedding dimensionality, different ideas on algorithm modifications, training data construction, choice of hyperparameters, etc.

One way of evaluating trained embeddings is to test how good they are in recommending listings that the user would book, based on their most recent click.

More specifically, let us assume we are given the most recently clicked listing and the listing candidates that need to be ranked, which contain the listing that user eventually booked. By calculating cosine similarities between embeddings of the clicked listing and the candidate listings we can rank the candidates and observe the rank position of the booked listing.

In the figure below we show results of one such evaluation where listings in search were re-ranked based on similarities in embedding space and rankings of booked listing are averaged for each click leading to booking, going as far back as 17 clicks before the booking to the last click before booking.

We compared several embedding versions 1) d32 regular trained without any modifications to the original embedding algorithm, 2) d32 booking global trained with bookings as global context and 3) d32 booking global + market negatives trained with bookings as global context and explicit negatives from same market (from our formula). From the consistent lower average ranking of booked listing we can conclude that d32 booking global + market negatives outperforms the other two embedding models.

Similar Listings using Embeddings

Every Airbnb home listing page contains a Similar Listings carousel that recommends listings which are similar to it and available for the same set of dates.

At the time of testing embeddings the existing algorithm for Similar Listings consisted of calling our main Search Ranking model for the same location as the given listing followed by filtering on same price range and listing type as the given listing.

We conducted an A/B test where we compared the existing Similar Listings algorithm at the time to our embedding-based solution, in which similar listings were produced by finding k-nearest neighbors in listing embedding space. More precisely, given learned listing embeddings, similar listings for a given listing l are found by calculating cosine similarity between its vector v(l) and vectors v(lj) of all listings from the same market that are available for the same set of dates (if check-in and check-out dates are set). The k=12 listings with the highest similarity were shown as similar listings.

The A/B test showed that embedding-based solution lead to a 21% increase in Similar Listing carousel CTR and 4.9% more guests discovering the listing they ended up booking in the Similar Listing carousel.

Real time personalization in Search using Embeddings

So far we’ve seen that embeddings can be used to efficiently calculate similarities between listings. Our next idea was to leverage this capability in Search Ranking for real-time in-session personalization, where the aim is to show to the guest more listings that are similar to the ones we think they liked since staring the search session and fever listings similar to the ones we think they did not like.

To achieve this, for each user we collect and maintain in real-time (using Kafka) two sets of short-term history events:

  1. Hc : set of listing ids that user clicked in last 2 weeks.
  2. Hs : set of listing ids that user skipped in last 2 weeks, where we define skipped listings as ones that were ranked high but skipped by user in favor of a click on a lower positioned listing

Next, each time the user conducts a search we calculate 2 similarity measures for each candidate listing lᵢ returned in search.

  • EmbClickSim : similarity between candidate listing embedding and embeddings of listings that user clicked on (from Hc).

Specifically, we calculate similarity between market-level centroids from Hc and pick the maximum similarity. For example if Hc contained listings from New York and Los Angeles, embeddings of listings for each of these two markets would be averaged out to form a market-level centroids.

  • EmbSkipSim : similarity between candidate listing embedding and embeddings of listings that user skipped (from Hs)

These two similarity measures were next introduced as additional signal that our Search Ranking Machine Learning model considers when ranking candidate listings.

This was done by first logging the two embedding similarity features along with other search ranking features so we can create a new labeled data set for model training and then proceeding to train a new ranking model that we can be tested agains the current production ranking model in a A/B test.

To evaluate if the new model learned to use the embedding similarity features as we intended, we plot their partial dependency plots below. These plots show what would happen to candidate listing ranking score if we fix values of all but a single feature (one we are examining).

On the left subgraph it can be seen that larger values of EmbClickSim (listing similar to listings user recently click on) lead to higher model score.

On the left subgraph it can be seen that larger values of EmbSkipSim (listing similar to listings user skipped, i.e. did not like) lead to lower model score.

Observations from partial dependency plots confirmed that features behavior matches what we intuitively expected the model will learn. In addition, the new embedding features ranked high in ranking model feature importances and our offline tests showed an improvement in performance metrics on a hold-out set when the embedding features were added to the model. This was enough for us to make a decision to proceed to an online experiment, which was successful and lead to the launch of embedding features for real-time personalization to production in Summer of 2017.

Interested in this type of work? We’re always looking for talented people to join our Data Science and Analytics team!

Many thanks to the entire Search Ranking team for contributions to the project, Peng Dai and Luca Luo who helped me launch Similar Listings using Embeddings and Navin Sivanandam who greatly helped with the blog post.

stat?event=post.clientViewed&referrerSou


Listing Embeddings for Similar Listing Recommendations and Real-time Personalization in Search was originally published in Airbnb Engineering & Data Science on Medium, where people are continuing the conversation by highlighting and responding to this story.

Via http://ift.tt/2FA4ISU

价值投资美股新手指南:赚钱靠工资,财富靠什么?

为什么我每个月辛辛苦苦工作,认认真真攒钱,却还是那么穷?

其实,你不妨换一个方式问自己:凭什么努力工作就应该变得富有?或者说,你有认识谁,是通过辛勤工作变得富有的?这个系列教程虽然是关于投资美股的,但在最开始,我想先和你聊一聊,财富究竟是怎样获得的。

劳动收入和资本收入

我们大多数人,每个月凭借着体力或脑力劳动,领着固定的工资,盼望着升职加薪。这样的收入来源非常稳定,然而问题在于,劳动收入的天花板是非常明显的。如果你的月工资是 2000 元,那么把心思放在提高自己的劳动技能稀缺度、熟练度等方面,的确有可能让你的收入增加到 10000 元甚至更高。

然而,工作一段时间后,你的劳动收入终将达到一个瓶颈,很难再突破下去。不考虑那些极端特殊的情况和人才,即使在北上广这样的一线城市,程序员的月薪天花板在 3-5 万元左右,教师的天花板在 2-3 万元左右,快递小哥的天花板在 1.5 万元左右。不是因为他们不够勤奋、不够努力,而是他们已经到达了社会对于劳动这个要素给予的报价上限。

没错,并不是你越努力,劳动收入就能越高。从某种程度上来说,劳动收入更取决于稀缺性。这也是为什么,即使在同一家公司,决定你整体薪酬水平的并非个人的努力程度,而是岗位。然而,如果你把眼界再放宽些,将劳动这个生产要素和其它生产要素相比,在整个社会层面上,它又是充裕的。这是什么意思呢?例如技术要素或土地要素:一项领先的技术往往可以带来时间和成本上的巨大优势,一块稀缺的土地资源可以拍出天价。可是,对于一个劳动者而言,在通常情况下,不管他有多厉害,一旦他的报价超过一个上限,我们会发现,总能找到相同水平,但要价更低的替代者。

与此同时,你一定也在各类新闻上看到过,许多公司的 CEO 每年只领一美元象征性的年薪。当然了,这些高管的报酬会通过股票等各种方式来补偿。不过,就如《21 世纪资本论》所述的那样,整个世界的财富差距正在逐渐拉大,如今的美国 70% 的财富掌握在最富有的 10% 的人手上,而最前面的 1% 的人,他们拥有的财富占了近 35%。对这部分人来说,他们不再需要靠劳动换取收入,相反,他们已经达到了「钱生钱」的境界。他们手中握有大量的资产,例如公司、股票、土地、债券等等,随着这些资产的增值,他们的财富也在不断膨胀。这就是所谓的资本收入

当然,纯粹只依靠劳动收入,或只有资本收入的两个人群,都是极端的两个端点。对于我们大部分人来说,现阶段最主要的收入来源,肯定还是按月发放的工资劳动收入。这并不是说花时间提升自己是没有意义的,而是说,你应该清晰地认识到自己所处行业和职位的天花板在哪里,一旦你的劳动收入达到了这个社会接受的天花板,从个人层面做出再多努力,也难有质的改变。

因此,一个理想的财富管理模式,应该是尽可能地将自己每个月固定的工资提升到天花板上限,同时将这些现金流再去投入购买资产,随着资产的升值产生资本收入。换言之,劳动收入是我们大多数人积累初始财富的通用方式,而想要实现财富的快速增长,把钱拿在手里肯定是跑不赢通货膨胀的,把它们置换成资产是更好的选择。

好的资产总是稀缺的。买房、自己创办公司、囤茅台、比特币、基金,甚至前几年炒作大蒜价格的「蒜你狠」,如果操作得当,都能为你带来资本收入。而这其中,门槛最低的,恐怕还是金融性资本收入了。

金融性资本收入带给我们的三大信心

金融性资本收入,包含了股票、债券、基金、理财等金融产品带来的收益。它的魅力,来自于它能带给我们每个人三大信心。

1. 超级回报的可能性

这一点其实并不仅仅适用于金融性资本收入,而是资本收入本身所具有的魅力。

涨薪的幅度如果有 30%~50%,已经是相当大了。再加上我们前面提到的劳动收入天花板效应,工作越久,劳动收入的想像空间也就越小。

而资本收入并没有这样的天花板,如果你挑选正确,还有可能享受到超级回报。腾讯自 2004 年上市至今,13 年的时间里,估值翻了 500 多倍。那时候的 1 万元,假设一直持有到现在,已经价值 500 多万元。而苹果在过去一年的时间里,也从每股 110 元上涨到了近 180 元,如果你重仓苹果,资产已经增加了 60%。

在这里,不仅仅有百分比的差异,时间也是另一个重要的差异。在你有一定财富的基础上,工资这样的劳动收入对财富的提升效应是微不足道的。假设你现在有 110 万元,如果全部购入苹果的股票,一年的时间就已经可以变成 180 万元。然而,如果这 70 万的增值要用工资来实现,即使按中国人均工资收入最高的城市北京来算,9000 元的月薪要积累到 70 万元,则需要大约 78 个月,也就是六年半的时间。

当然,这一切的前提,是你要发现优质的资产。这不是一件简单的事情,但至少给你提供了可能性。而这种可能性,是劳动收入所无法提供的。

2. 你就是不用干活的老板

许多人羡慕老板的生活,或者想要自己当老板,源自于对老板的刻板印象:底下的人辛苦工作帮老板赚大钱了,老板拿的是大头,自己永远是那点固定工资。这个问题的实质,其实是财富的分配。创造财富的可能是劳动者,但是掌握分配权的,却一定是财富的所有者(如公司股东)。

因此,掌握财富的分配权非常重要,而花钱买入金融性资产,可能是这个世界上最容易的获取所有权的方式了。你不需要去工商局登记注册,不需要考虑招聘,不需要考虑业绩指标……你要做的,只是在交易所买下 10 支股票,瞬间你就成为了 10 家公司的小小股东之一,这些公司赚钱了,你作为企业的所有者之一,哪怕微不足道,却能享有利润的分配和企业估值的增长收益。这其实给了你极大的信心,相当于除了自己努力工作之外,你还可以仅仅通过购入股票,就同时雇佣了多个世界上最优秀的管理团队和员工,让他们为你打工

3. 钱是平等的

作为一名劳动者,在市场竞争中,你会发现竞争如此激烈。招聘时要看各类证书和经历,入职后免不了评级打分,一不小心还要被末位淘汰。

如果你想成为一名苹果的员工呢?在 Apple Park,这里有近 2 万名员工,你必须有十分亮丽的教育背景和工作经历,才有机会成为那里的一员。

现在,欢迎你来到钱的世界,这里就公平多了。在这里,钱本身没有好坏优劣之分。巴菲特的钱可以买入苹果的股票,你的钱,同样也可以。钱的无差异性,让你不仅可以成为一个不用干活的老板,通过股票市场,你还可以成为任意一家公司的老板。

当然,在真实世界中,多多少少肯定还会存在着一些准入门槛,大多体现在资金规模层面上。部分私募基金只面对特定群体发售,理财产品五万起售,或者你想买入腾讯的股票?按照香港交易所的规定,购入股票的最小单位是「一手」,即 100 股,按腾讯最近 400 多港元的股价来看,你必须要一次性拿出约 4 万人民币,才能成为腾讯的股东。

但是,和买房、自己投钱创办公司等相比,一手腾讯股票的 4 万块钱,对大多数人容易多了。加上近些年来 P2P 金融等领域的快速发展,越来越多的资产项目可以 1 元起购,也能享受到原来至少 100 万起购的信托收益了。在这一点上,金融性资产面前,钱钱平等。

超级回报,也对应着超级亏损

我不得不在此强调的是,本次教程中所涉及的任何例子,都不构成具体的投资建议。你一定要明白,我们前面提到的超级回报,其所对应的悲观情况,便是超级亏损。

超级亏损的风险,主要来自于标的资产的灭失和金融性资本的价格下跌。

前者很容易理解,把货币转换为金融性资产后,一旦相应的资产灭失,就会彻底血本无归。例如,P2P 平台跑路已经不是什么新鲜事了。这一类的风险,其实倒还可以防范,通过正规渠道,购买正规的资产,基本能保障安全。

真正具有杀伤力的,是金融资产的价格暴跌。其实,货币也同样存在这样的问题,你手中持有的货币,会随着时间而通货膨胀,变得越来越不值钱。只不过在一个社会环境稳定的国家,这样的通胀是缓慢的,但金融性资产不同,一只股票可以一夜之间暴跌 50%,相当于一夜之间财富缩水一半。例如,红黄蓝幼儿园在今年的丑闻曝光后,一夜之间股价就下跌了 46%。既然你是经验丰富的投资者,也难免会有看走眼的时候,像对冲基金大佬 Bill Ackman,其重仓的生物医药股 Valeant 在一系列丑闻曝光后,股价从 2015 年的高点 250 多美元,一路下跌到了今天的 20 美元。

想要通过金融性资产赚钱,也必须做好超级亏损的心理准备。这也是为什么许多金融性资产在购买前,都必须要求你完成风险等级测试,以评估你的风险承诺能力。在这个付费系列教程中,我们也会从选股方面,来探讨如何尽可能地降低美股的亏损风险。

关于《价值投资美股新手指南》这套教程

售价 ¥ 49

点此链接 可直接跳转至栏目订阅页面,由于少数派 iOS 客户端尚在审核,我们推荐你先通过网页进行购买和阅读。

为了让之前没有下载过 App 的新朋友能够先用上 App,我们启用了一个临时版本以供使用,该版本所有功能基本正常,已适配 iPhone X,但是,无法在 App 内购买付费栏目。有需求的同学可以填写 📝表单申请

本系列付费教程的主题,是用价值投资的思维框架来入门美股投资。从第一篇开始,我们会真正进入正题,并依次探讨以下话题:

  • 为什么选择投资美股
  • 为什么选择价值投资
  • 价值投资框架下,如何选股
  • 财务基础入门 101
  • 选择我的美股券商
  • 买美股,用美元
  • 买入卖出我的第一支美股

可以看到,整个教程主要分为了两大部分:第一部分,是从「道」的层面,帮助零基础新手建立一套属于你自己的基本投资理念和思维框架。第二部分,则是从「术」的层面,向你介绍美股的基本开户指南、入门知识、汇款指南等内容。

需要强调的是……

这套教程中没有我个人的 Secret Sauce,我不是在分享我个人的投资经验、秘籍或建议,更不是告诉你,如何能够持续获得超越市场的收益率。从大的角度来看,教程只谈论了两件事情:一是美股市场、价值投资、基本面分析、财务入门的一些基本理念,二是开户、入金等实操类事项。

通过这个教程,你不可能获得对某个行业深刻的洞见,也不会知道具体该买哪只股票。这些是你需要靠自己真正下功夫努力的地方。可以这样说,这套教程内的所有内容,如果你有足够的耐心和时间,都可以自行摸索入门,你现在只是有了另一个选择,通过这套教程来节约你「被领进门」的时间成本,但之后依然是「修行在个人」。

最后,请时刻谨记:股市有风险,投资需谨慎。这个教程没有办法帮你百分百赚钱,否则它就不会只卖这个价了:)

Via http://ift.tt/2EvqPZ5

Lessons from Spotify

The two dominant business models for venture-backed startups are advertising for consumer-focused companies, and Software-as-a-Service (SaaS) for business-focused ones. On one level, these business models are quite different: the former gives away software for free with the hope of convincing a third party to pay for access to users; the latter charges some portion of users directly. The underlying economics of both, though, are more similar than you might think — indeed, both are very much in line with venture-backed startups of the past.

Venture Outcomes

Silicon Valley is, unsurprisingly given the name, built on silicon-based computer chips, and that goes for Silicon Valley venture capital, as well. Silicon-based chips have minimal marginal costs — sand is cheap! — but massive fixed costs: R&D on one hand, and the equipment to actually make the chips on the other. And while those two costs live on different parts of the income statement — the latter is a cost of revenue that impacts gross margins, while the former is “under the line” and an operational cost that only impacts overall profitability — the fundamental economic rationale for taking on venture capital is the same: spend a lot of money up-front to develop and build a product, and take advantage of minimal marginal costs to make it up in volume.

You can see how this model translated perfectly to software: marginal costs were even lower, and an even greater percentage of costs were R&D. Companies needed lots of money to get started, but those that succeeded could generate returns that vastly exceeded the amount of investment. This is certainly the case for today’s business models.

Advertising-based consumer companies spend huge amounts on R&D building products that appeal to users, although usually not a lot on sales and marketing to acquire users; consumer companies that break through to the scale necessary to support advertising rely on viral network effects. Where the sales and marketing spend comes is in courting advertisers; however, the most valuable consumers companies of all — the super-aggregators — generate the same sort of network effects allowing them to add advertisers in a scalable way as well.

This produces the ideal venture outcome: a company where users and revenue grow far more quickly than costs.

Graph of a Venture Company's Costs

Again, this is possible because there are minimal marginal costs — more users are not necessarily more expensive. Of course fixed costs grow over time, but they only grow linearly — earning ever-increasing revenue on a relatively stable cost basis is the definition of scale.

SaaS businesses have the same sort of profile — the big difference is that revenue comes from users, and thus sales and marketing expenses are spent on gaining said users, not advertisers, but minimal marginal costs are the common thread.

Spotify’s Operational Costs

In The Business of SaaS, one of the guides offered by Stripe Atlas, Patrick McKenzie writes:

Margins, to a first approximation, don’t matter. Most businesses care quite a bit about their cost-of-goods-sold (COGS), the cost to satisfy a marginal customer. While some platform businesses (like AWS) have material COGS, at the typical SaaS company, the primary source of value is the software and it can be replicated at an extremely low COGS. SaaS companies frequently spend less than 5~10% of their marginal revenue per customer on delivering the underlying service.

This allows SaaS entrepreneurs to almost ignore every factor of their unit economics except customer acquisition cost (CAC; the marginal spending on marketing and sales per customer added). If they’re quickly growing, the company can ignore every expense that doesn’t scale directly with the number of customers (i.e. engineering costs, general and administrative expenses, etc), on the assumption that growth at a sensible CAC will outrun anything on the expenses side of the ledger.

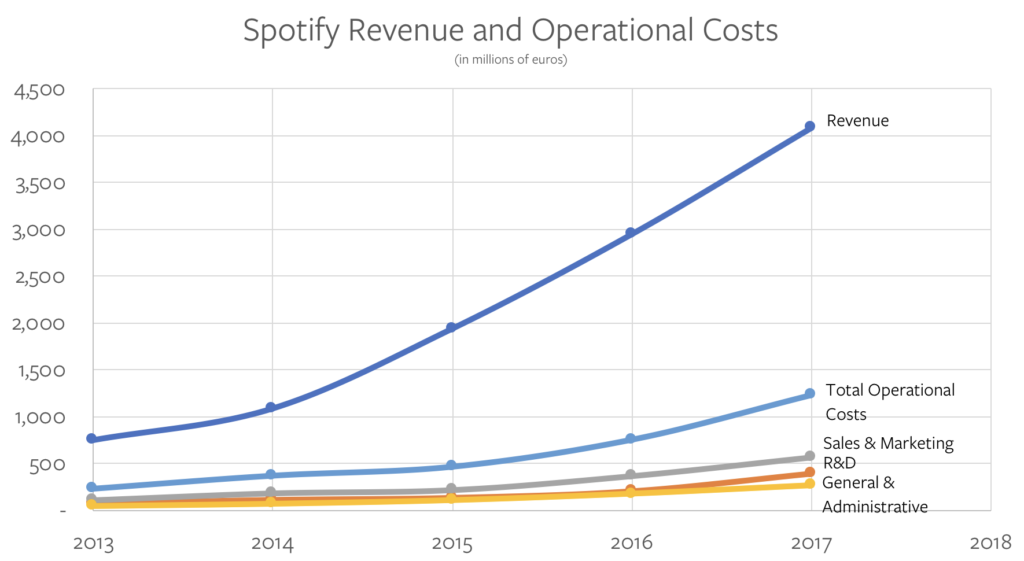
In other words, operational costs don’t matter in the long run, which is good news for Spotify, a venture-backed company with definite SaaS characteristics that filed for a direct listing last week. Spotify has increased monthly active users by 43% over the last three years and revenue by 448% over the last five; its fixed costs have largely tracked revenue:

SPOTIFY REVENUE AND FIXED COSTS (IN MILLIONS OF EUROS)
Revenue R&D (% Rev) S&M (% Rev) G&A (% Rev) Total (% Rev)
2013 746 73 (10%) 111 (15%) 42 (6%) 226 (30%)
2014 1,085 114 (11%) 184 (17%) 67 (6%) 365 (34%)
2015 1,940 136 (7%) 219 (11%) 106 (5%) 461 (26%)
2016 2,952 207 (7%) 368 (12%) 175 (6%) 750 (25%)
2017 4,090 396 (10%) 567 (14%) 264 (6%) 1,227 (30%)

This looks like a well-managed SaaS company:

Spotify Revenue and Operational Costs

There’s just one problem: Spotify’s marginal costs.

Spotify’s Marginal Cost Problem

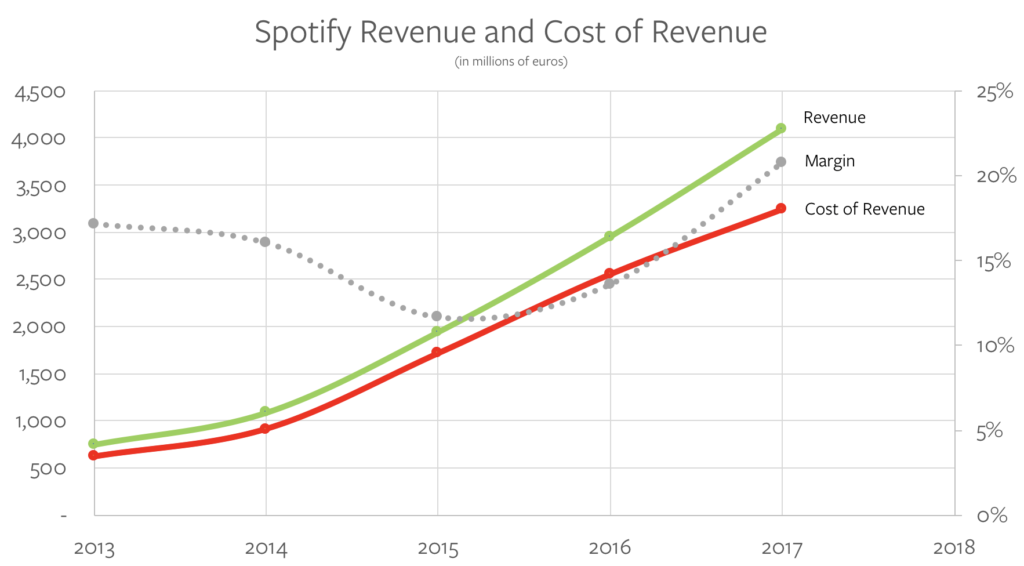
It is not exactly groundbreaking analysis to note that Spotify has significant marginal costs — specifically, the royalties it pays the music industry (not just record labels but also songwriters and publishers). Those are represented by Spotify’s Cost of Revenue:

Spotify Revenue and Cost of Revenue

Spotify negotiated new deals with the record labels last summer that resulted in lower royalty rates in exchange for guaranteed subscriber growth and the ability for the labels to make some releases exclusive to Spotify’s paid tier; you can see those lower rates reflected in Spotify’s increased margins.

Spotify’s Missing Profit Potential

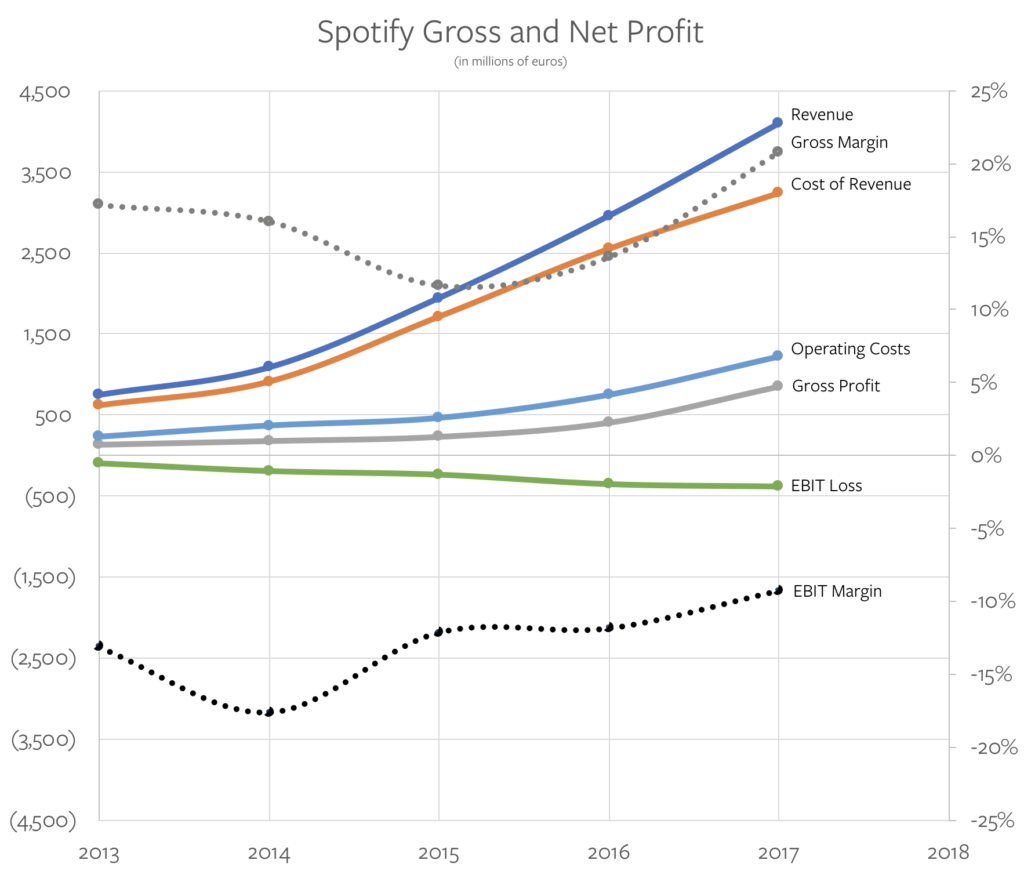
That, though, is precisely the problem: Spotify’s margins are completely at the mercy of the record labels, and even after the rate change, the company is not just unprofitable, its losses are growing, at least in absolute euro terms:

Spotify Gross and Net Profit

Moreover, it seems highly unlikely Spotify’s Cost of Revenue will improve much in the short-term: those record deals are locked in until at least next year, and they include “most-favored nation” provisions, which means that Spotify has to get Universal Music Group, Sony Music Entertainment, Warner Music Group, and Merlin (the representative for many independent labels), which own 85% of the music on Spotify as measured by streams, to all agree to reduce rates collectively. Making matters worse, the U.S. Copyright Royalty Board just increased the amount to be paid out to songwriters; Spotify said the change isn’t material, but it certainly isn’t in the right direction either.

That leaves two options:

  • Most obviously Spotify could try and lower its operational costs. This, though, is harder than it might seem for two reasons: first, Spotify is already a pretty frugal company; Dropbox, for example, which filed its S-1 the same week, spends 77% of revenue on operational costs as compared to Spotify’s 30%.
  • Spotify could grow its revenue without increasing its operational costs. How, though, will it grow revenue if it cannot increase its spending on R&D and Sales & Marketing? The typical pattern for non-social network companies is for Sales & Marketing to grow less efficient over time, which means it would need to increase as a percentage of revenue, not decrease (and remember, Spotify can’t afford to miss its growth numbers or its royalty rates go up).

There is one more possibility: Spotify could one day cut out the labels altogether — the idea certainly makes sense on a conceptual level. Spotify is in one sense an aggregator, in that it increasingly controls access to music listeners, and to the company’s credit, it has demonstrated the ability to exercise power via its control of music discovery and popular playlists.

The problem is that the music labels, as I wrote in The Great Unbundling, have been strengthened by Spotify as well:

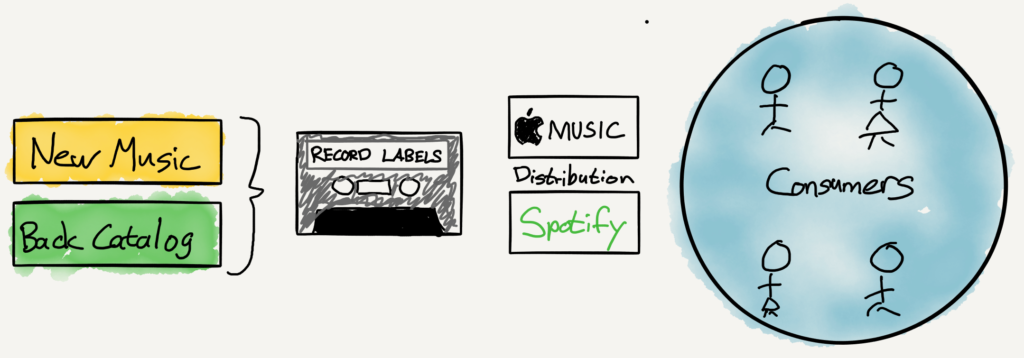
The music industry, meanwhile, has, at least relative to newspapers, come out of the shift to the Internet in relatively good shape; while piracy drove the music labels into the arms of Apple, which unbundled the album into the song, streaming has rewarded the integration of back catalogs and new music with bundle economics: more and more users are willing to pay $10/month for access to everything, significantly increasing the average revenue per customer. The result is an industry that looks remarkably similar to the pre-Internet era:

Notice how little power Spotify and Apple Music have; neither has a sufficient user base to attract suppliers (artists) based on pure economics, in part because they don’t have access to back catalogs. Unlike newspapers, music labels built an integration that transcends distribution.

Spotify is an impressive product and company, and CEO Daniel Ek and team deserve credit for reaching this point. Being a true aggregator, though, means gaining power over supply; Spotify doesn’t have that — the company doesn’t even have control over its marginal costs — and it’s hard to see where the profits come from.

Lessons from Spotify

The power of the record labels and the resultant linkage of Spotify’s marginal costs to its overall revenue certainly makes Spotify a unique case compared to most zero marginal cost venture-backed companies:

Graph of Company with Marginal Costs Linked to Revenue

It’s worth noting, though, that Spotify is hardly the only well-known startup that has its cost of revenue linked to total revenue — at least from a certain perspective. Over the last few years there has been a third model of startup that has emerged: the so-called sharing economy, or Assets-as-a-Service (AaaS). When you spend $10 on an Uber or Lyft ride, around $7 goes to the driver; when you spend $100 on an Airbnb, $85 goes to the host,1 and so on and so forth.

This isn’t how these companies necessarily keep their books, to be clear: the top line number should exclude whatever is paid out to the driver or host etc. When thinking about how these companies should be managed, though, the situation isn’t much different than Spotify. Specifically:

  • AaaS companies can’t assume that operational expenses are “free”, because gross marginal costs are going to eat up a huge portion of gross revenue growth.
  • AaaS companies should focus Sales & Marketing spending on increasing demand, and allow demand to draw supply. Doing it the other way — spending Sales & Marketing to increase supply in the hope of drawing demand — may make sense competitively, but it is a disaster financially, as the company is basically spending to increase its costs (imagine if Spotify were paying millions to court the record labels!)
  • AaaS companies that can’t lower their operational costs or grow revenue relatively faster than Sales & Marketing will be left rolling the dice on eliminating marginal costs entirely. Granted, self-driving cars or owned-and-operated apartments may both be more viable than getting rid of the record labels, but it still seems a better bet to become far more disciplined when it comes to operational costs.

I still believe in a future where Everything is a Service, and there’s no question that creating networks for everything will need a lot of venture capital. And make no mistake — there will continue to be capital available, because a network, once made, absolutely offers the sort of scalable revenue generation that makes generating significant profits an inevitability.

To that end, it is surely Spotify’s hope that the streaming market ends up being so big that the company’s low gross margin in percentage terms ends up large in absolute ones; even then those profits will come from operational excellence and efficient customer acquisition, not simply top-line growth.

  1. Minus service fees to cover payment processing

Via http://ift.tt/2tl7VQe

The Dropbox Comp

I am usually quite conservative when it comes to how much time, data, and effort I am willing to put into a product from a new startup: too many go out of business or are acquired-and-sunset, and who wants to go to the effort twice?

Dropbox, though, was something else entirely: the initial release in 2008 was so good, and filled such a need, that I switched all of my most important data there immediately and I’ve never left, even though I have lots of free data storage included with other SaaS software plans. Indeed, I was so convinced that Dropbox wasn’t going anywhere that I felt no compunction about using Dropbox (plus a bit of Apple Script) as a de facto syncing system for a school I was working at; it has been ten years, the school has expanded to multiple locations, and every classroom still has the exact same set of files thanks to a product that does exactly what it promises. And now the company behind it is going public — I knew it!

Still, even if the utility and durability of Dropbox’s product was immediately apparent, the long-run trajectory of its business is, even with the release of the company’s S-1, less so.

Dropbox Versus Box and the Question of Lifetime Value

Dropbox and Box have always been compared, and for a rather obvious reason: the core offering of both companies is cloud storage. Said comparison, though, mostly serves to highlight that while the two companies might have similar products, there are so many other ways to be different.

First and foremost, Box has, since the earliest days of the company, been focused on enterprise customers, while Dropbox started out as a consumer product. I explained why this mattered in 2014’s Battle of the Box:

Dropbox’s model makes sense theoretically, but it ignores the messy reality of actually making money. After all, notably absent from my piece on Business Models for 2014 was consumer software-as-a-service. I’m increasingly convinced that, outside of in-app game purchases, consumers are unwilling to spend money on intangible software. That is likely why Dropbox has spent much of the last year pivoting away from consumers to the enterprise.

There are multiple reasons why the latter is a more attractive target for all software-as-a-service companies, especially those focused on data:

  • Consumers need to be convinced of the value of their data…
  • Consumers have multiple free options…
  • Consumers are hard to market to…
  • For consumers, collaboration is an edge case…
  • Building a platform for consumers is incredibly difficult…

I concluded by arguing that $10 million invested in Box at its-then $2 billion valuation was a better bet than the same $10 million invested in Dropbox at its-then $10 billion valuation; given that Box has a $3.2 billion market capitalization while Dropbox is hoping its IPO will clear that same $10 billion mark, I’m (fake) rich!

Dropbox, though, has indeed pivoted: the company said in its S-1:

Of our 11 million paying users, approximately 30% use Dropbox for work on a Dropbox Business team plan, and we estimate that an additional 50% use Dropbox for work on an individual plan, collectively totaling approximately 80% of paying users.

Still, significant differences remain: Dropbox’s customer base, thanks to all those consumers, is over 500 million users (Dropbox announced 500 million signups last March, but explained in its S-1 that it had culled what were apparently ~100 million inactive accounts over the last year), while Box, as of last quarter, had only 57 million registered accounts. On the other hand, 17% of Box’s users had paid accounts; only 2% of Dropbox’s did. This contrast in efficiency gets at the biggest difference between the two companies: to whom they sell, and how they go about doing so.

Box sells to big companies using a traditional sales force; free accounts exist primarily to enable temporary collaboration with paid accounts, as well as trials. There is a self-

serve option, but that’s not the point: Box notes in its financial filings that “Our marketing strategy also depends in part on persuading users who use the free version of our service to convince decision-makers to purchase and deploy our service within their organization”. In other words, when it comes to Box’s ideal customer, the CIO decides for everyone all at once.

For Dropbox, on the other hand, self-serve is the most important channel by far. The company brags that “We generate over 90% of our revenue from self-serve channels — users who purchase a subscription through our app or website.” Dropbox has a sales team, but as it notes in its S-1, the team “focuses on converting and consolidating these separate pockets of usage into a centralized deployment. Nearly all of our largest outbound deals originated as smaller self-serve deployments.”

There are pros and cons to both approaches. Start with the obvious difference: customer acquisition cost. While the two companies spent a comparable amount on sales and marketing in the third quarter of 2017 ($81.7 million for Box, and $74.7 million for Dropbox1), for Box that represented 63% of revenue; for Dropbox it was only 26%.2

However, the two numbers aren’t as comparable as they seem: specifically, Box’s Sales and Marketing includes the infrastructure and support costs of those free users; Dropbox’s doesn’t. Rather, the company includes those costs in its Cost of Revenue, which is a big reasons Dropbox’s gross margin of 68% trails Box’s 73%.3 And, by extension, we don’t really know what Dropbox’s customer acquisition cost is.

There is another advantage of selling to top-down decision-makers: the opportunity to build solutions for specific needs, and charge accordingly. This has enabled Box to achieve negative churn: in all of its cohorts the company is increasing its revenue-per-user by a faster rate than it is losing users overall, which means revenue-per-cohort increases over time. The company explained this in its amended S-1:

Our business model focuses on maximizing the lifetime value of a customer relationship. We make significant investments in acquiring new customers and believe that we will be able to achieve a positive return on these investments by retaining customers and expanding the size of our deployments within our customer base over time…

We experience a range of profitability with our customers depending in large part upon what stage of the customer phase they are in. We generally incur higher sales and marketing expenses for new customers and existing customers who are still in an expanding stage…For typical customers who are renewing their Box subscriptions, our associated sales and marketing expenses are significantly less than the revenue we recognize from those customers.

box1

Box went on to give numbers for specific cohorts; Dropbox, unfortunately, was significantly less specific:

As we continue to innovate and optimize our go-to-market strategy, we have successfully increased monetization for subsequent cohorts. Comparing January cohorts from the last three years, at virtually every point in time after signup, the January 2017 cohort generated a higher monthly subscription amount than the January 2016 cohort, which in turn generated a higher monthly subscription amount than the January 2015 cohort.

This sounds good, until you actually try to figure out what it means. Is the January 2017 cohort monetizing more because users are paying more quickly, or because there are more users? How many of those users are churning, and is there an increase in revenue-per-customer to counteract that?

Dropbox’s S-1 doesn’t give the answer to the first two questions, but the answer to the third seems to be “no”. Average revenue per paying user is actually down from 2015 ($113.54 to $111.91), although slightly up from 2016 ($110.54). Given the model, though, this isn’t a surprise: the only way to serve a massive user-base efficiently is to have a fairly standardized offering; creating and selling differentiating features that increase the average revenue per paying customer doesn’t scale.

There is one other big advantage in terms of Dropbox’s model, at least from a founder and early investor perspective: the tradeoff of Box earning ever-increasing amounts of revenue per paying customer is the amount it takes to land that customer in the first place. This is why Box’s losses were so large, and why founder and CEO Aaron Levie was so diluted by the time the company finally IPO’d (Levie owned just over 5% of Box at the time of IPO). Dropbox founder and CEO Drew Houston, on the other hand, still owns 25%, and early investor Sequoia Capital another 23%; a founder retaining that much ownership is much more characteristic of a consumer company than an enterprise one — which is exactly how Dropbox started.

Dropbox Versus Atlassian and the Question of Market Size

Still, Houston’s ownership stake pales in comparison to Scott Farquhar and Mike Cannon-Brookes, co-founders and co-CEOs of Atlassian, who owned 37.7% of the company each when it IPO’d two years ago. Not coincidentally, Atlassian was very much a pioneer in the self-serve model when it comes to enterprise software, and as I wrote at the time of their S-1, it helped that the company was selling to developers:

Agile was largely developer-driven, another factor that worked in JIRA and Atlassian’s favor. Developers are, quite obviously, much more willing to do their own research on products, download and trial software from the Internet, and if they like it, proselytize to other developers even if they don’t work for the same company. In other words, of all the different types of enterprise software, development tools are uniquely suited to spreading somewhat virally without the need for a traditional sales force.

One of the big questions at the time of Atlassian’s IPO was just how big their market was — specifically, could the company start selling beyond its developer base? So far the results are encouraging: JIRA Service Desk, the company’s attempt to expand its JIRA project management software to non-developer teams, is in over 25,000 organizations, and the company overall continues to grow both by adding new customers and by selling more products to existing customers.

This is the second question for Dropbox, beyond the uncertainty around its customer acquisition costs and churn: to what extent can it expand its market? On the positive side, those 500 million users are all potential customers; on the other, the vast majority of them have avoided paying for ten years — the proportion of paid users has barely budged over time. And again, Dropbox hasn’t developed ways for its already paying customers to pay it more.

The potential is certainly there: note that Atlassian’s growth, with a similar model to Dropbox’s, is far out-pacing Box’s — 42% in 3Q 2017 (Atlassian’s FY Q1 2018), compared to 26% — but then again it is far out-pacing Dropbox’s 30% as well. That Dropbox’s revenue growth is slowing suggests the company is ultimately a niche player.

Dropbox Versus Slack and the Question of the Enterprise OS

I once thought that Dropbox — and Box, for that matter — could be more than that; in 2014 I wrote Box, Microsoft, and the Next Enterprise Platform:

Pure storage isn’t a great business. The cost is trending towards zero, as noted by Levie himself. Data, though, is priceless; it can’t be replaced, and it’s the essence of what makes a particular organization unique…Just because the operating system is no longer the platform does not mean that the need – and opportunity – for a platform does not exist. Something needs to tie together all those computing devices, and data, which needs to be everywhere, is the logical place to start.

Dropbox made a similar argument in its S-1:

Our modern economy runs on knowledge. Today, knowledge lives in the cloud as digital content, and Dropbox is a global collaboration platform where more and more of this content is created, accessed, and shared with the world. We serve more than 500 million registered users across 180 countries…

Our market opportunity has grown as we’ve expanded from keeping files in sync to keeping teams in sync. Today, Dropbox is well positioned to reimagine the way work gets done. We’re focused on reducing the inordinate amount of time and energy the world wastes on “work about work” — tedious tasks like searching for content, switching between applications, and managing workflows.

The shift in focus from data to people is one I made myself in 2015; commenting on that Box OS article above, I wrote:

I think, in retrospect, I outsmarted myself: companies aren’t made of data, they’re made of people, just like every other single institution on earth. And, as I noted in the context of Facebook, what people love to do, more than anything else in the world, is communicate. Why wouldn’t you start there?

To that end Dropbox is marketing itself to investors as a collaboration company, and heavily emphasizing Dropbox Paper. In the meantime, though, another company — the one I was writing about in that excerpt — has entered the scene: Slack.

It’s hard to see anyone — including Microsoft — having a bigger opportunity than Slack.4 The trend in every aspect of computing is higher and higher levels of abstraction, and that doesn’t apply just to things like programming languages. In the case of platforms, the operating system of the PC used to really matter, and then the Internet came along and it didn’t. Similarly, in mobile, the operating system, whether that be iOS or Android, used to really matter, but now it doesn’t. In the consumer space, Facebook or WeChat runs on both, and that is far more important to the day-to-day experience of the vast majority of people.

It turns out that “mobile” is not about devices, but rather, at a fundamental level, about computing anywhere; to differentiate between PCs or phones is an ultimately meaningless exercise. They are simply different form factors of effectively identical devices, the purpose of which is to connect us to the cloud (consumer or enterprise). And, by extension, if the device is simply an implementation detail, then the operating system that runs on that device is a detail of a detail.

What matters — what always matters! — is what actual users want to do, and what jobs they want to accomplish. And, whatever they want to do almost certainly involves communicating, which means Slack and its competitors are the best-placed to be the foundational platform of the cloud epoch. More broadly, humans are social creatures: why should we be surprised that social networks are primed to be the most important businesses of all?

It’s been two years since I wrote that, and while Slack is still growing, albeit more slowly, the question of which company controls the future of enterprise computing remains an open one. Is it Amazon via infrastructure, Microsoft via infrastructure and identity and email, Slack via chat? Google via all-of-the-above?

What seems clear is that it won’t be Dropbox — both because files weren’t the right route and also because the company spent far too much time and energy chasing a non-existent consumer opportunity — but that’s ok. There is still value — at least $10 billion in value, I’d bet — in doing a job and doing it well, whether that be as a startup in 2008 or a public company in 2018. We still need to share files (and yes, collaborate on them), and will need to do so for a very long time, and Dropbox does it better than anyone. I just wish Dropbox’s S-1 didn’t make it so difficult to figure out just how much value there might be.

  1. This number jumped to $102.9 million in the fourth quarter, which is a much larger jump than any previous fourth quarter, perhaps in anticipation of the IPO filing
  2. Per the previous footnote, in the fourth quarter sales and marketing was 34% of revenue
  3. More on Dropbox’s dropping Cost of Revenue tomorrow
  4. Note that I said “opportunity”; opportunity means it’s possible, not that it’s necessarily going to happen

Via http://ift.tt/2sYDqPZ

2017 年,我用 Timetrack 有效地实现了自我量化 | 2017 年度征文

「我是少数派,这是我的 2017」年度征文入围作品

本文是「我是少数派,这是我的 2017」征文活动的第 31 篇入围作品,想了解如何参与本次征文,赢取各种丰厚奖品,你可以 点此查看 活动规则和奖品清单。

本文仅代表作者本人观点,少数派仅对标题和排版略作调整。


楔子

Timetrack 是一个挺小众的 App,主要帮用户纪录和追踪时间开销。

当然,这件事还有一个更高大上的名字叫:自我量化(Quantified Self)

比尔·盖茨在一封公开信上专门讨论过这个问题,他提到:

我深深感受到「量化措施」对于改善人类状况的重要性。如果你制订一个明确的目标并找到一种能朝着目标推进的计量手段,你就可以取得不可思议的进步。这看上去似乎是基本要求,但令人惊讶的是人们经常没能做到,做对也非常困难。我深深感受到「量化措施」对于改善人类状况的重要性。如果你制订一个明确的目标并找到一种能朝着目标推进的计量手段,你就可以取得不可思议的进步。这看上去似乎是基本要求,但令人惊讶的是人们经常没能做到,做对也非常困难。

正如比尔·盖茨所说,量化很重要,也很困难,它帮助像柳比歇夫这样极致的自我量化者取得举世瞩目的成就,也帮助像 Linkedin 这样坚定的数据驱动型公司获得商业上的巨大成功。

路径显而易见,又艰难无比。

我认为,timetrack 最大的价值就是让比尔·盖茨所说的「非常困难」的事情能够通过工具变得简单可行,让我们能够轻松地完成时间管理范畴的自我量化。

下面我就来介绍这款我在 2017 年打开频率最高、对我影响最大、我心目中绝对的年度最佳应用:timetrack

1. 强大的基础功能

第一部分先来谈一谈这款工具的基础功能:时间记录。同类的效率工具其实不少,比如 TogglHarvestDovicoiHour时间块等等,即便和专业的时间记录产品比较,timetrack 在基础功能上也毫不逊色。

1.1 便捷的时间纪录

在最初使用的时候,可以先从系统预设的活动开始。

操作的方法非常简单,点击图标启动计时,timetrack 会同时显示两个时间进程,一个是本次活动的时间,一个是目标时间。比如从下面这张图我们能看出来:已经工作了 19 分钟,离本次目标达成还有 1 小时 40 分钟。

活动当中遇到偶尔的打断,可以暂停计时,活动结束之后,点击按钮或直接启动新活动也会停止此次计时。

我在去年入手了 Apple watch,并把 timetrack 放到表盘的一角。这让我不仅能随时了解当下的时间记录情况,还能直接在手表上进行时间记录的操作,简直是其疾如风啊。

1.2 可视化的数据呈现

记录时间的主要目的在于总结和复盘,以帮助我们持续改进,所以光记录没有用,还要能查阅分析这些数据,我们先来看看大神柳比歇夫用纸笔完成的一次时间记录:

基于这样的原始数据,柳比歇夫的每一次总结还需要额外的反复誊抄、计算,而现在,有了 timetrack,你只需要极低的成本便可以实现比大神好得多得多的数据呈现效果。目前 timetrack 提供三种不同的视图呈现方式:

  • 列表视图:查阅每一天所有时间记录的明细;
  • 日历视图:概览一整天的工作、学习、生活情况;
  • 饼状视图:了解每天、每周和每月的时间分配比例。

到了年底,还可以导出一整年的数据,通过 Nmmber 或者 Excel 等工具进行更深度的数据挖掘。

1.3 提醒记录时间

时间记录是一个主动行为,而且像读书、健身一样,不是想做就能做好的。在决定自我量化以后,我也经历了一段颇为漫长的习惯养成阶段,下面要介绍的就是在这期间给了我不少j帮助的两个功能。

第一是提醒记录时间的功能,timetrack 每隔一段时间可以提醒你一次「别忘了记录时间」。我最初设定的是每两个小时提醒一次,防止我忙起来忘了计时。timetrack 还支持后台勾选提醒的时间范围,为了不让它在凌晨 3 点钟提醒你记录时间,建议让它和你的作息时间尽可能的保持一致。

除此之外,timetrack 能够基于地理位置的变化而提醒,支持调取百度地图的 API,我分享两个自己设置过的提醒:

timetrack 一旦发现我抵达单位马上会提醒我「制定当日计划」,防止我毫无头绪地扎进琐碎的事务中。

回到家, timetrack 会提醒我「做做家务」,主要是到家总是忘了切换计时的活动,当然主要还是勉励自己「回家先收拾收拾屋子啊」。

当然,随着每天的刻意重复,我们终会养成习惯,那一天,也是我们关闭提醒的时候。所有的提醒和推送都会消耗我们的注意力资源,所以,千万不要过于依赖。

2. 低配的快速启动器

Launch Center Pro(以下简称 LCP) 曾经是我重度使用的一个 App,它帮我快速打开各种软件和服务,在使用过一段时间,形成肌肉记忆之后,闭着眼睛也可以打开想要的程序。

把常用的 App 放到 LCP 中,不常用的使用 Spotlight 搜索,这种模式帮我节省了大量打开 App 的时间。

悲催的是,因为还有记录时间的习惯,在很长的一段时间,我的操作都只能是:打开 LCP,启动 timetrack 开始计时,返回 LCP,打开某个 App。有时候还要再额外开一个倒计时,这个成本高昂的操作实在是太反人性了,导致最后基本处于半放弃的状态。

然而,这一切都在 timetrack 的 1.3.1 版本更新之后发生了变化,在那之后 timetrck 开始支持调用 URL,这个不算多么重大的更新,让记录时间的体验有了跨越式提升。

2.1 用 URL 倍增时间记录效率

我会用 timetrack 帮我记录睡眠时间,也同步在使用 Sleep Cycle 帮我监测睡眠质量,以前我需要在两个工具之间来回切换,现在只需要在 timetrack 里面点击「睡眠」。开始启动时间记录的同时,会自动跳转到 Sleep Cycle 中:

同样的方法,在 timetrack 中点击「日记」会打开 Day One,点击「背单词」会打开 Anki 等等,几乎所有常用的 App 都可以通过 timetrack 来实现快速启动,这个体验非常美好。

虽然我一直主张「用工具,不要 All in one」,不同的工具解决不同的问题,但这样的功能组合实在是堪称完美,让人难以抗拒。

2.2 配合 Workflow,解锁高级玩法

我是一个重度的播客收听者,所以在 timetrack 中预设了「播客」活动。但在国内,一个不得不面对的问题是,即便用 Overast 这样的泛播客工具,还是无法全方位聚合像得到 App、喜马拉雅、荔枝 FM 等所有平台的优质内容。

我习惯早起洗漱听得到,通勤听喜马拉雅的付费课程,做家务用 Overcast 听「大内密谈」,要想实现这样的效果,简单的 URL 就不够了,为此我专门做了一个辅助的 Workflow,最终实现的效果如下:

这样,每次在 timetrack 点击「播客」,根据不同的时段选择不同的收听内容,不仅把两个步骤合并到了一起,还减少了所有播客的收听入口,让听播客这件事完美融合到每天不同的收听场景中。

2.3 简洁好看也是生产力

单纯以一款启动器来论,timetrack 也有两个不得不提的亮点:

首先是支持活动分组。比如热爱学习的我设置了种类丰富的学习活动,这些都放在主屏的话,显得,我也太热爱学习了,不符合我低调内敛的性格。于是我把它们统统放到了学习活动的群组中,这也让主屏幕显得更清爽一些。

其次是精美的图标。下面这张图是我的活动主界面,个人觉得我精心挑选的这些图标还挺好看的,搭配不同颜色还有一定的警示作用(特意把娱乐、刷社交 App 设置了是红色)。

然而,为了写这篇文章,我随手看了一眼内置的图标库,发现最新的图标已经不知不觉达到了这个水平:

从单色升级到彩色,不仅有扁平风格还有拟物风格,论颜值真不一定输给专业的快速启动工具。

3. 目标,时间追踪的仪表盘

「目标」在软件的 Dock 栏占据了 1/4 的位置,可谓份量十足。位置往往最能反应开发者对一个功能的重视程度,但是 timetrack 的「目标」可能是最容易被大家忽略的一项功能。坦白讲,我自己一开始也搞不清楚:有每天、每周、每月的「时间统计」,我们还需要「目标」做什么?

随着我对时间管理,特别是项目管理有了更多的认识,才逐渐意识到「目标」在一款自我量化的工具中的地位有多重要,毫不夸张地说,它就像飞机的仪表盘一样不可或缺。

3.1 给所有的任务装一个进度条

每个人都希望拥有更高的效率、更好的节奏,养成更多的好习惯,以期达成更伟大的成就。这当然有种种不易,但让很多人放弃的,不只有过程的艰辛,很多时候是因为看不到自己的进步,似乎只是在原地踏步的糟糕感受。

所以,有没有可能,制定一个目标,然后把它分解到每一天。比如,不再是我要读 50 本书,我要养成写作的习惯,而是我希望可以:

  • 每天冥想 10 分钟
  • 每天写作 30 分钟
  • 每天看书 1 小时
  • 每天睡眠 7 小时
  • 等等

为了确保这些习惯不只是美好的愿望,不要只是把它们写在纸上、贴在墙上,而是直接纳入到自我量化的系统中,在 timetrack 里实时追踪。这样,当我做每一件事情的时候,我都能看到,这个目标的进度条在一点一点地被填满。

不要小看那种完成每一个目标的,实实在在的前进感,它能给人非常大鼓舞和力量。

除了可视化之外,timetrack 会在任务达成时发出提醒,阅读、写作、冥想,不管做什么,当听到那一声专属的清脆铃声,我便知道「嗯,今天的小目标,又完成了一个」,这种踏踏实实的成就感非常容易上瘾。

3.2 给坏习惯画一条红线

timetrack 不仅可以帮我们实现目标,更能让我们控制坏习惯,它非常人性化地对「目标」设置了两种计时方式:

我希望每天刷微信微博的时间不超过 1 个小时。所以,我创建了一个「刷社交 App」的小目标,目标的规则是:不超过 1 小时。

人生其实没有我们感觉的那么漫长,如果明明每次做某件事情都会自责懊悔,完全不做又不太现实,那还是给自己拉一条红线,设置一个合理的范围吧,让自己不要过于沉溺其中。

我每次刷微博之前都会点击启动计时,这其实就是在跟自己确定「你是否决定把自己短暂且宝贵的人生耗费在马上要做的这件无聊的事情上?」

如果确定,也不再瞻前顾后,而是:尽!情!刷!因为我知道 timetrack 会在后台不疾不徐地走着秒针,耗费了今天的所有刷微博的时间,它也会无情地提醒我:你今天的余额已不足。

不得不说,这个小 Tip 对我用刷社交 App 来 kill time 起到了不小的遏制作用。

3.3 给单次活动瘦身,给习惯养成减压

我一直以来都非常推崇通过场景切换的方式来辅助习惯养成。起床、通勤、吃饭、睡觉前都是典型的场景切换。

举个例子,比如我自己,每次一上地铁,第一件事先打开 Anki 背几个单词,这个习惯断断续续也坚持了快一年的时间,

我最大的心得是:除了在「目标」里设定每天背诵 30 分钟单词之外,最好再设定一个「单次背单词 10 分钟」的平行目标。也就是说虽然背单词的总目标是半小时,但每次上地铁背单词只需要完成 10 分钟就好,只要听到 timetrack 的提醒,就可以去听歌、刷知乎或者做其他的事情啦。30 分钟、一个小时可能让人压力不小,一个只需要 10 分钟的行动就显得轻松愉快多了。

4. 内置的番茄工作法让工作更加专注

从 08 年到现在,我使用过几十款不同的番茄钟,有简洁专注的 BeFocused、有功能全面的番茄土豆、有可以种树的 Forest 等等等等,每一款工具都有自己独特的优势。

我在不同的工具之间来来回回地选择,付出了不小的时间成本。最终依然是 timetrack 终结了这个动荡的局面。自从 timetrack 内置番茄钟功能之后,我毫不犹豫地将其他番茄钟 App 都尽数雪藏了。这和前面提到的快速启动 App 的原因一样,因为时间记录和开始一个番茄钟,在逻辑上本就应该合并成一个动作。即便 timetrack 的番茄钟做得中规中矩,但由于其内置在时间记录的工具里,拥有传统的番茄钟无法比拟的独特优势。

4.1 真 · 减少操作

我们不会做所有的事情都用番茄工作法,所以首先需要在 timetrack 选择会触发番茄钟的活动类别,我自己目前设置了工作、写作、专业学习这三项活动。比如,点击「工作」,系统会提示是否启动番茄钟,可以选择使用番茄也可以选择常规计时。

虽然它没有社交、不能结合 todolist、可视化也做得一般,但我真心愿意用这些作为代价换取操作成本的减少。

4.2 所有活动都可备注

番茄工作法有一个很重要的规则:记录每一个番茄钟的完成情况,这样才能发现真正影响我们专注工作的原因。timetrack 的备注功能可以非常完美地实现这个需求。我们只需要点击番茄钟进入活动详情,在这里我们可以为活动贴标签、写备注,记录每一个活动的完成情况,补充有没有超时、有没有被打断等信息。

4.3 让休息也能有迹可循

使用番茄钟常遇到的一个问题是休息的时间过长,本来 5 分钟的休息,一个不留神,30 分钟就过去了。但这个最容易溜走的时间大多数番茄钟并不会记录。因为 timetrack 的强项就是精准计时,自然支持把番茄钟的休息时间也关联到具体的活动类别。

所以一次休息结束,你马上能看到,这次休息的时间是多久,有没有超时,超了多少,一天当中所有的休息时间也都会忠实地记录下来,这一点是大多数番茄 App 所不能及的。

结语

自我量化不是一件容易的事情,和看书、写作、健身一样,都需要下定决心,持续坚持。在众多生产力工具当中,timetrack 是最容易被放弃的一个,因为记录时间真的不是那么刚需,做与不做,在短期内几乎没有任何差别。即便是经常需要按小时计费的法律服务行业,真正养成计时习惯的律师也是少之又少。

然而,就和其他所有「重要不紧急」的事情一样,虽然它们没有 deadline,虽然它们会占用你不少的时间,虽然它们一般不那么立竿见影。但,相信我,它们真的值得!

柳比歇夫用怀表和纸笔都做到了这一点,更何况我们还有 timetrack 这样优秀工具的帮助呢。

最后,希望大家都能用自我量化的方式更好地认识自己,也欢迎大家通过微博(@Louiscard)或者在行和我交流更多自我量化的有趣实践。

手机想要更好用,还得有方法,下载 少数派、关注 少数派公众号

Via http://ift.tt/2t89p0a

2017 年,我用 Timetrack 有效地实现了自我量化 | 2017 年度征文

「我是少数派,这是我的 2017」年度征文入围作品

本文是「我是少数派,这是我的 2017」征文活动的第 31 篇入围作品,想了解如何参与本次征文,赢取各种丰厚奖品,你可以 点此查看 活动规则和奖品清单。

本文仅代表作者本人观点,少数派仅对标题和排版略作调整。


楔子

Timetrack 是一个挺小众的 App,主要帮用户纪录和追踪时间开销。

当然,这件事还有一个更高大上的名字叫:自我量化(Quantified Self)

比尔·盖茨在一封公开信上专门讨论过这个问题,他提到:

我深深感受到「量化措施」对于改善人类状况的重要性。如果你制订一个明确的目标并找到一种能朝着目标推进的计量手段,你就可以取得不可思议的进步。这看上去似乎是基本要求,但令人惊讶的是人们经常没能做到,做对也非常困难。我深深感受到「量化措施」对于改善人类状况的重要性。如果你制订一个明确的目标并找到一种能朝着目标推进的计量手段,你就可以取得不可思议的进步。这看上去似乎是基本要求,但令人惊讶的是人们经常没能做到,做对也非常困难。

正如比尔·盖茨所说,量化很重要,也很困难,它帮助像柳比歇夫这样极致的自我量化者取得举世瞩目的成就,也帮助像 Linkedin 这样坚定的数据驱动型公司获得商业上的巨大成功。

路径显而易见,又艰难无比。

我认为,timetrack 最大的价值就是让比尔·盖茨所说的「非常困难」的事情能够通过工具变得简单可行,让我们能够轻松地完成时间管理范畴的自我量化。

下面我就来介绍这款我在 2017 年打开频率最高、对我影响最大、我心目中绝对的年度最佳应用:timetrack

1. 强大的基础功能

第一部分先来谈一谈这款工具的基础功能:时间记录。同类的效率工具其实不少,比如 TogglHarvestDovicoiHour时间块等等,即便和专业的时间记录产品比较,timetrack 在基础功能上也毫不逊色。

1.1 便捷的时间纪录

在最初使用的时候,可以先从系统预设的活动开始。

操作的方法非常简单,点击图标启动计时,timetrack 会同时显示两个时间进程,一个是本次活动的时间,一个是目标时间。比如从下面这张图我们能看出来:已经工作了 19 分钟,离本次目标达成还有 1 小时 40 分钟。

活动当中遇到偶尔的打断,可以暂停计时,活动结束之后,点击按钮或直接启动新活动也会停止此次计时。

我在去年入手了 Apple watch,并把 timetrack 放到表盘的一角。这让我不仅能随时了解当下的时间记录情况,还能直接在手表上进行时间记录的操作,简直是其疾如风啊。

1.2 可视化的数据呈现

记录时间的主要目的在于总结和复盘,以帮助我们持续改进,所以光记录没有用,还要能查阅分析这些数据,我们先来看看大神柳比歇夫用纸笔完成的一次时间记录:

基于这样的原始数据,柳比歇夫的每一次总结还需要额外的反复誊抄、计算,而现在,有了 timetrack,你只需要极低的成本便可以实现比大神好得多得多的数据呈现效果。目前 timetrack 提供三种不同的视图呈现方式:

  • 列表视图:查阅每一天所有时间记录的明细;
  • 日历视图:概览一整天的工作、学习、生活情况;
  • 饼状视图:了解每天、每周和每月的时间分配比例。

到了年底,还可以导出一整年的数据,通过 Nmmber 或者 Excel 等工具进行更深度的数据挖掘。

1.3 提醒记录时间

时间记录是一个主动行为,而且像读书、健身一样,不是想做就能做好的。在决定自我量化以后,我也经历了一段颇为漫长的习惯养成阶段,下面要介绍的就是在这期间给了我不少j帮助的两个功能。

第一是提醒记录时间的功能,timetrack 每隔一段时间可以提醒你一次「别忘了记录时间」。我最初设定的是每两个小时提醒一次,防止我忙起来忘了计时。timetrack 还支持后台勾选提醒的时间范围,为了不让它在凌晨 3 点钟提醒你记录时间,建议让它和你的作息时间尽可能的保持一致。

除此之外,timetrack 能够基于地理位置的变化而提醒,支持调取百度地图的 API,我分享两个自己设置过的提醒:

timetrack 一旦发现我抵达单位马上会提醒我「制定当日计划」,防止我毫无头绪地扎进琐碎的事务中。

回到家, timetrack 会提醒我「做做家务」,主要是到家总是忘了切换计时的活动,当然主要还是勉励自己「回家先收拾收拾屋子啊」。

当然,随着每天的刻意重复,我们终会养成习惯,那一天,也是我们关闭提醒的时候。所有的提醒和推送都会消耗我们的注意力资源,所以,千万不要过于依赖。

2. 低配的快速启动器

Launch Center Pro(以下简称 LCP) 曾经是我重度使用的一个 App,它帮我快速打开各种软件和服务,在使用过一段时间,形成肌肉记忆之后,闭着眼睛也可以打开想要的程序。

把常用的 App 放到 LCP 中,不常用的使用 Spotlight 搜索,这种模式帮我节省了大量打开 App 的时间。

悲催的是,因为还有记录时间的习惯,在很长的一段时间,我的操作都只能是:打开 LCP,启动 timetrack 开始计时,返回 LCP,打开某个 App。有时候还要再额外开一个倒计时,这个成本高昂的操作实在是太反人性了,导致最后基本处于半放弃的状态。

然而,这一切都在 timetrack 的 1.3.1 版本更新之后发生了变化,在那之后 timetrck 开始支持调用 URL,这个不算多么重大的更新,让记录时间的体验有了跨越式提升。

2.1 用 URL 倍增时间记录效率

我会用 timetrack 帮我记录睡眠时间,也同步在使用 Sleep Cycle 帮我监测睡眠质量,以前我需要在两个工具之间来回切换,现在只需要在 timetrack 里面点击「睡眠」。开始启动时间记录的同时,会自动跳转到 Sleep Cycle 中:

同样的方法,在 timetrack 中点击「日记」会打开 Day One,点击「背单词」会打开 Anki 等等,几乎所有常用的 App 都可以通过 timetrack 来实现快速启动,这个体验非常美好。

虽然我一直主张「用工具,不要 All in one」,不同的工具解决不同的问题,但这样的功能组合实在是堪称完美,让人难以抗拒。

2.2 配合 Workflow,解锁高级玩法

我是一个重度的播客收听者,所以在 timetrack 中预设了「播客」活动。但在国内,一个不得不面对的问题是,即便用 Overast 这样的泛播客工具,还是无法全方位聚合像得到 App、喜马拉雅、荔枝 FM 等所有平台的优质内容。

我习惯早起洗漱听得到,通勤听喜马拉雅的付费课程,做家务用 Overcast 听「大内密谈」,要想实现这样的效果,简单的 URL 就不够了,为此我专门做了一个辅助的 Workflow,最终实现的效果如下:

这样,每次在 timetrack 点击「播客」,根据不同的时段选择不同的收听内容,不仅把两个步骤合并到了一起,还减少了所有播客的收听入口,让听播客这件事完美融合到每天不同的收听场景中。

2.3 简洁好看也是生产力

单纯以一款启动器来论,timetrack 也有两个不得不提的亮点:

首先是支持活动分组。比如热爱学习的我设置了种类丰富的学习活动,这些都放在主屏的话,显得,我也太热爱学习了,不符合我低调内敛的性格。于是我把它们统统放到了学习活动的群组中,这也让主屏幕显得更清爽一些。

其次是精美的图标。下面这张图是我的活动主界面,个人觉得我精心挑选的这些图标还挺好看的,搭配不同颜色还有一定的警示作用(特意把娱乐、刷社交 App 设置了是红色)。

然而,为了写这篇文章,我随手看了一眼内置的图标库,发现最新的图标已经不知不觉达到了这个水平:

从单色升级到彩色,不仅有扁平风格还有拟物风格,论颜值真不一定输给专业的快速启动工具。

3. 目标,时间追踪的仪表盘

「目标」在软件的 Dock 栏占据了 1/4 的位置,可谓份量十足。位置往往最能反应开发者对一个功能的重视程度,但是 timetrack 的「目标」可能是最容易被大家忽略的一项功能。坦白讲,我自己一开始也搞不清楚:有每天、每周、每月的「时间统计」,我们还需要「目标」做什么?

随着我对时间管理,特别是项目管理有了更多的认识,才逐渐意识到「目标」在一款自我量化的工具中的地位有多重要,毫不夸张地说,它就像飞机的仪表盘一样不可或缺。

3.1 给所有的任务装一个进度条

每个人都希望拥有更高的效率、更好的节奏,养成更多的好习惯,以期达成更伟大的成就。这当然有种种不易,但让很多人放弃的,不只有过程的艰辛,很多时候是因为看不到自己的进步,似乎只是在原地踏步的糟糕感受。

所以,有没有可能,制定一个目标,然后把它分解到每一天。比如,不再是我要读 50 本书,我要养成写作的习惯,而是我希望可以:

  • 每天冥想 10 分钟
  • 每天写作 30 分钟
  • 每天看书 1 小时
  • 每天睡眠 7 小时
  • 等等

为了确保这些习惯不只是美好的愿望,不要只是把它们写在纸上、贴在墙上,而是直接纳入到自我量化的系统中,在 timetrack 里实时追踪。这样,当我做每一件事情的时候,我都能看到,这个目标的进度条在一点一点地被填满。

不要小看那种完成每一个目标的,实实在在的前进感,它能给人非常大鼓舞和力量。

除了可视化之外,timetrack 会在任务达成时发出提醒,阅读、写作、冥想,不管做什么,当听到那一声专属的清脆铃声,我便知道「嗯,今天的小目标,又完成了一个」,这种踏踏实实的成就感非常容易上瘾。

3.2 给坏习惯画一条红线

timetrack 不仅可以帮我们实现目标,更能让我们控制坏习惯,它非常人性化地对「目标」设置了两种计时方式:

我希望每天刷微信微博的时间不超过 1 个小时。所以,我创建了一个「刷社交 App」的小目标,目标的规则是:不超过 1 小时。

人生其实没有我们感觉的那么漫长,如果明明每次做某件事情都会自责懊悔,完全不做又不太现实,那还是给自己拉一条红线,设置一个合理的范围吧,让自己不要过于沉溺其中。

我每次刷微博之前都会点击启动计时,这其实就是在跟自己确定「你是否决定把自己短暂且宝贵的人生耗费在马上要做的这件无聊的事情上?」

如果确定,也不再瞻前顾后,而是:尽!情!刷!因为我知道 timetrack 会在后台不疾不徐地走着秒针,耗费了今天的所有刷微博的时间,它也会无情地提醒我:你今天的余额已不足。

不得不说,这个小 Tip 对我用刷社交 App 来 kill time 起到了不小的遏制作用。

3.3 给单次活动瘦身,给习惯养成减压

我一直以来都非常推崇通过场景切换的方式来辅助习惯养成。起床、通勤、吃饭、睡觉前都是典型的场景切换。

举个例子,比如我自己,每次一上地铁,第一件事先打开 Anki 背几个单词,这个习惯断断续续也坚持了快一年的时间,

我最大的心得是:除了在「目标」里设定每天背诵 30 分钟单词之外,最好再设定一个「单次背单词 10 分钟」的平行目标。也就是说虽然背单词的总目标是半小时,但每次上地铁背单词只需要完成 10 分钟就好,只要听到 timetrack 的提醒,就可以去听歌、刷知乎或者做其他的事情啦。30 分钟、一个小时可能让人压力不小,一个只需要 10 分钟的行动就显得轻松愉快多了。

4. 内置的番茄工作法让工作更加专注

从 08 年到现在,我使用过几十款不同的番茄钟,有简洁专注的 BeFocused、有功能全面的番茄土豆、有可以种树的 Forest 等等等等,每一款工具都有自己独特的优势。

我在不同的工具之间来来回回地选择,付出了不小的时间成本。最终依然是 timetrack 终结了这个动荡的局面。自从 timetrack 内置番茄钟功能之后,我毫不犹豫地将其他番茄钟 App 都尽数雪藏了。这和前面提到的快速启动 App 的原因一样,因为时间记录和开始一个番茄钟,在逻辑上本就应该合并成一个动作。即便 timetrack 的番茄钟做得中规中矩,但由于其内置在时间记录的工具里,拥有传统的番茄钟无法比拟的独特优势。

4.1 真 · 减少操作

我们不会做所有的事情都用番茄工作法,所以首先需要在 timetrack 选择会触发番茄钟的活动类别,我自己目前设置了工作、写作、专业学习这三项活动。比如,点击「工作」,系统会提示是否启动番茄钟,可以选择使用番茄也可以选择常规计时。

虽然它没有社交、不能结合 todolist、可视化也做得一般,但我真心愿意用这些作为代价换取操作成本的减少。

4.2 所有活动都可备注

番茄工作法有一个很重要的规则:记录每一个番茄钟的完成情况,这样才能发现真正影响我们专注工作的原因。timetrack 的备注功能可以非常完美地实现这个需求。我们只需要点击番茄钟进入活动详情,在这里我们可以为活动贴标签、写备注,记录每一个活动的完成情况,补充有没有超时、有没有被打断等信息。

4.3 让休息也能有迹可循

使用番茄钟常遇到的一个问题是休息的时间过长,本来 5 分钟的休息,一个不留神,30 分钟就过去了。但这个最容易溜走的时间大多数番茄钟并不会记录。因为 timetrack 的强项就是精准计时,自然支持把番茄钟的休息时间也关联到具体的活动类别。

所以一次休息结束,你马上能看到,这次休息的时间是多久,有没有超时,超了多少,一天当中所有的休息时间也都会忠实地记录下来,这一点是大多数番茄 App 所不能及的。

结语

自我量化不是一件容易的事情,和看书、写作、健身一样,都需要下定决心,持续坚持。在众多生产力工具当中,timetrack 是最容易被放弃的一个,因为记录时间真的不是那么刚需,做与不做,在短期内几乎没有任何差别。即便是经常需要按小时计费的法律服务行业,真正养成计时习惯的律师也是少之又少。

然而,就和其他所有「重要不紧急」的事情一样,虽然它们没有 deadline,虽然它们会占用你不少的时间,虽然它们一般不那么立竿见影。但,相信我,它们真的值得!

柳比歇夫用怀表和纸笔都做到了这一点,更何况我们还有 timetrack 这样优秀工具的帮助呢。

最后,希望大家都能用自我量化的方式更好地认识自己,也欢迎大家通过微博(@Louiscard)或者在行和我交流更多自我量化的有趣实践。

手机想要更好用,还得有方法,下载 少数派、关注 少数派公众号

Via http://ift.tt/2t89p0a